Accounts Receivable Dashboard
Use the Accounts Receivable Dashboard to better understand your account receivables for the last 13 months.
Accounts Receivable (AR) Aging Bucket Chart
The AR Aging Bucket Chart shows the aging of your AR for the last 13 months (at the end of the period), summarized by aging buckets. The buckets are assigned based on the number of days between the service date and the last day of the indicated period.
-
0-120 days
-
120-180 days
-
181-240 days
-
241-365 days
-
Over 365 days
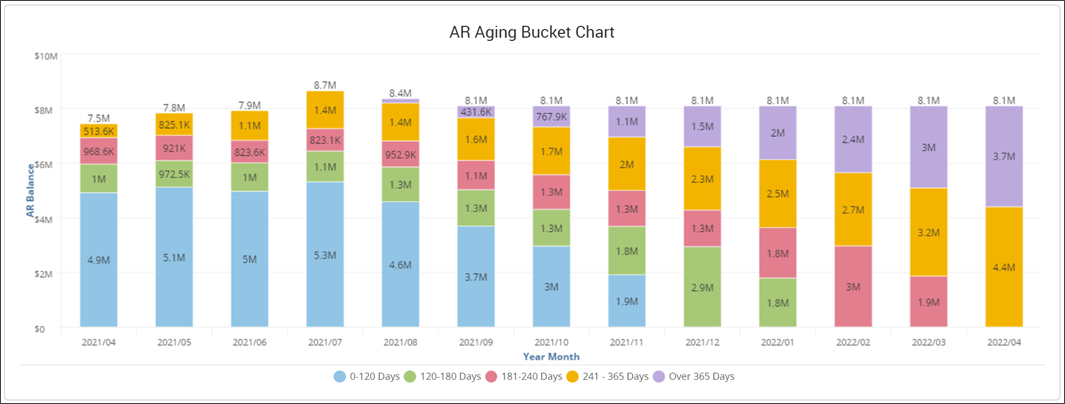
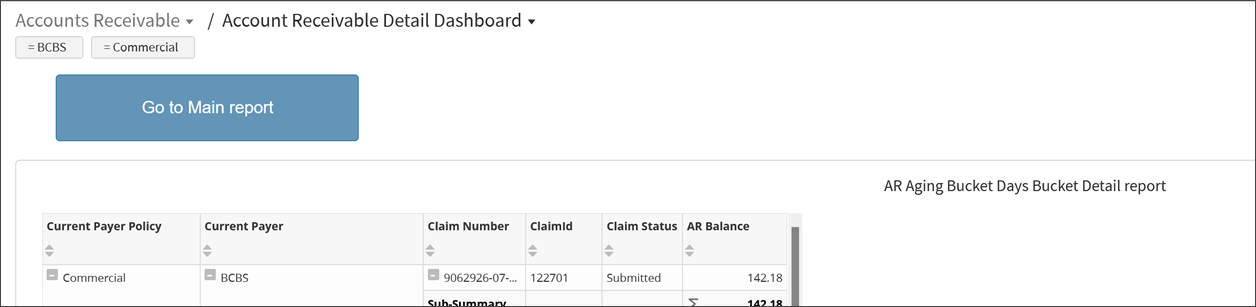
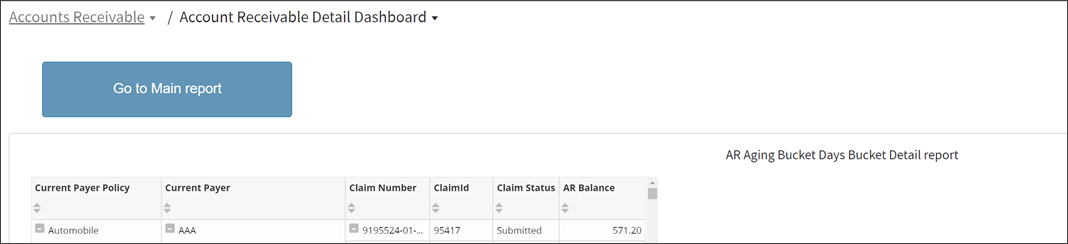
Drill down: Click on a bucket to see data details.
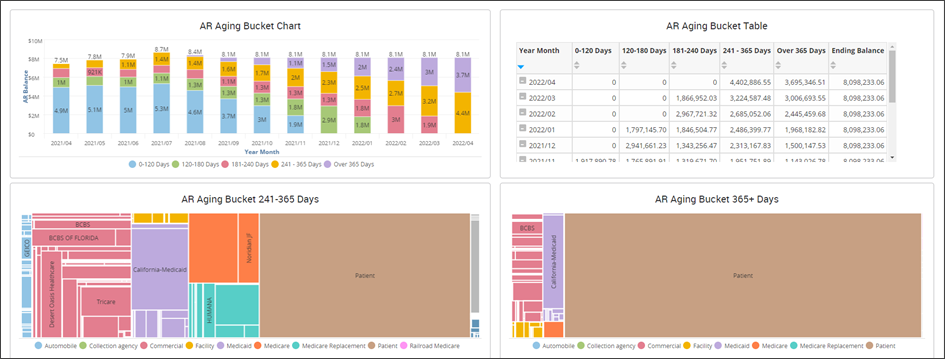
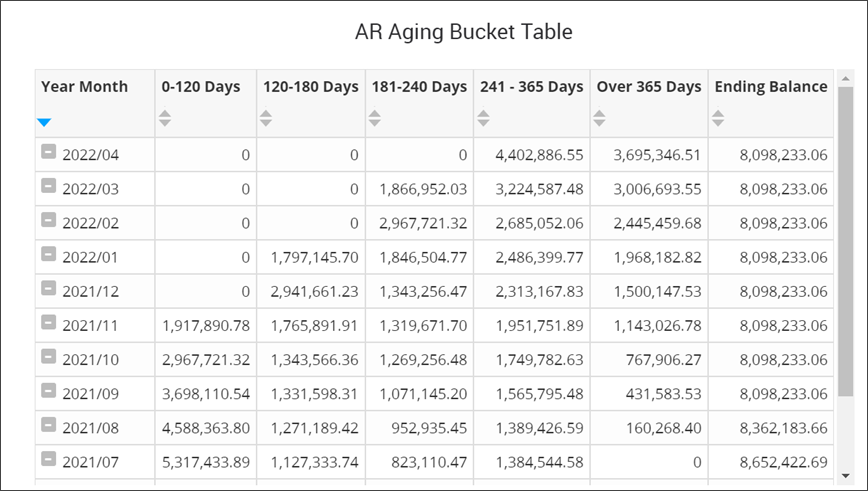
AR Aging Bucket Table
The AR Aging Bucket Table shows the aging information for the last 13 months in a table format. The data is summarized by the same aging buckets as seen in the AR Aging Bucket Chart.
AR Aging Bucket 241-365 Days
This color coded graph highlights the balances for the current payer policy and then breaks it down by the current payer. The size of the rectangles reflects the portion of the total aging for the 241 to 365 days.
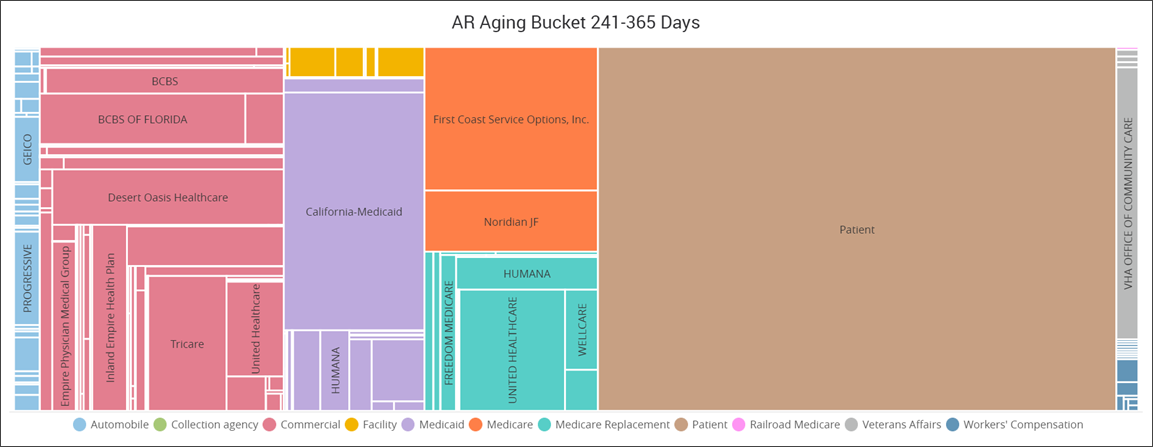
Drill down: Click on a rectangle to see the current payer details.

AR Aging Bucket Over 365 Days
This color coded graph highlights the balances for the current payer policy and then breaks it down by the current payer. The size of the rectangles is based on the portion of the total aging of payers over 365 days.
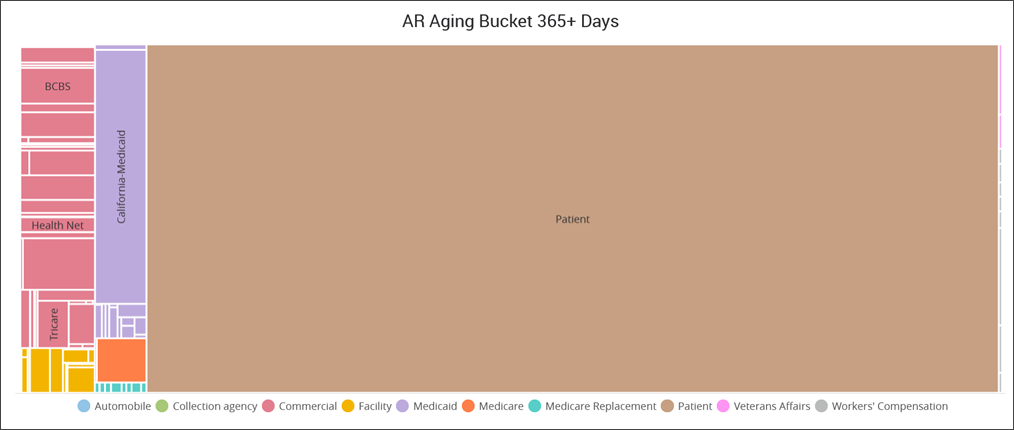
Drill down: Click on the rectangle to see the current payer details.